Insight Columns
Scaling comparative analysis of private technology companies with AI.
Role
Lead Product Designer
Time Frame
2 sprints (roughly 6 weeks)
Context
Leadership came to the team with a request: build a more advanced data table inside ChatCBI, our LLM chatbot. The idea was that users could run comparative analysis on companies at scale. ChatCBI had become hugely popular with our customer base, but it had limitations. LLM-generated answers worked well for qualitative questions about individual companies. They broke down when users tried to standardize that analysis across 15, 20, or 50 companies at once.

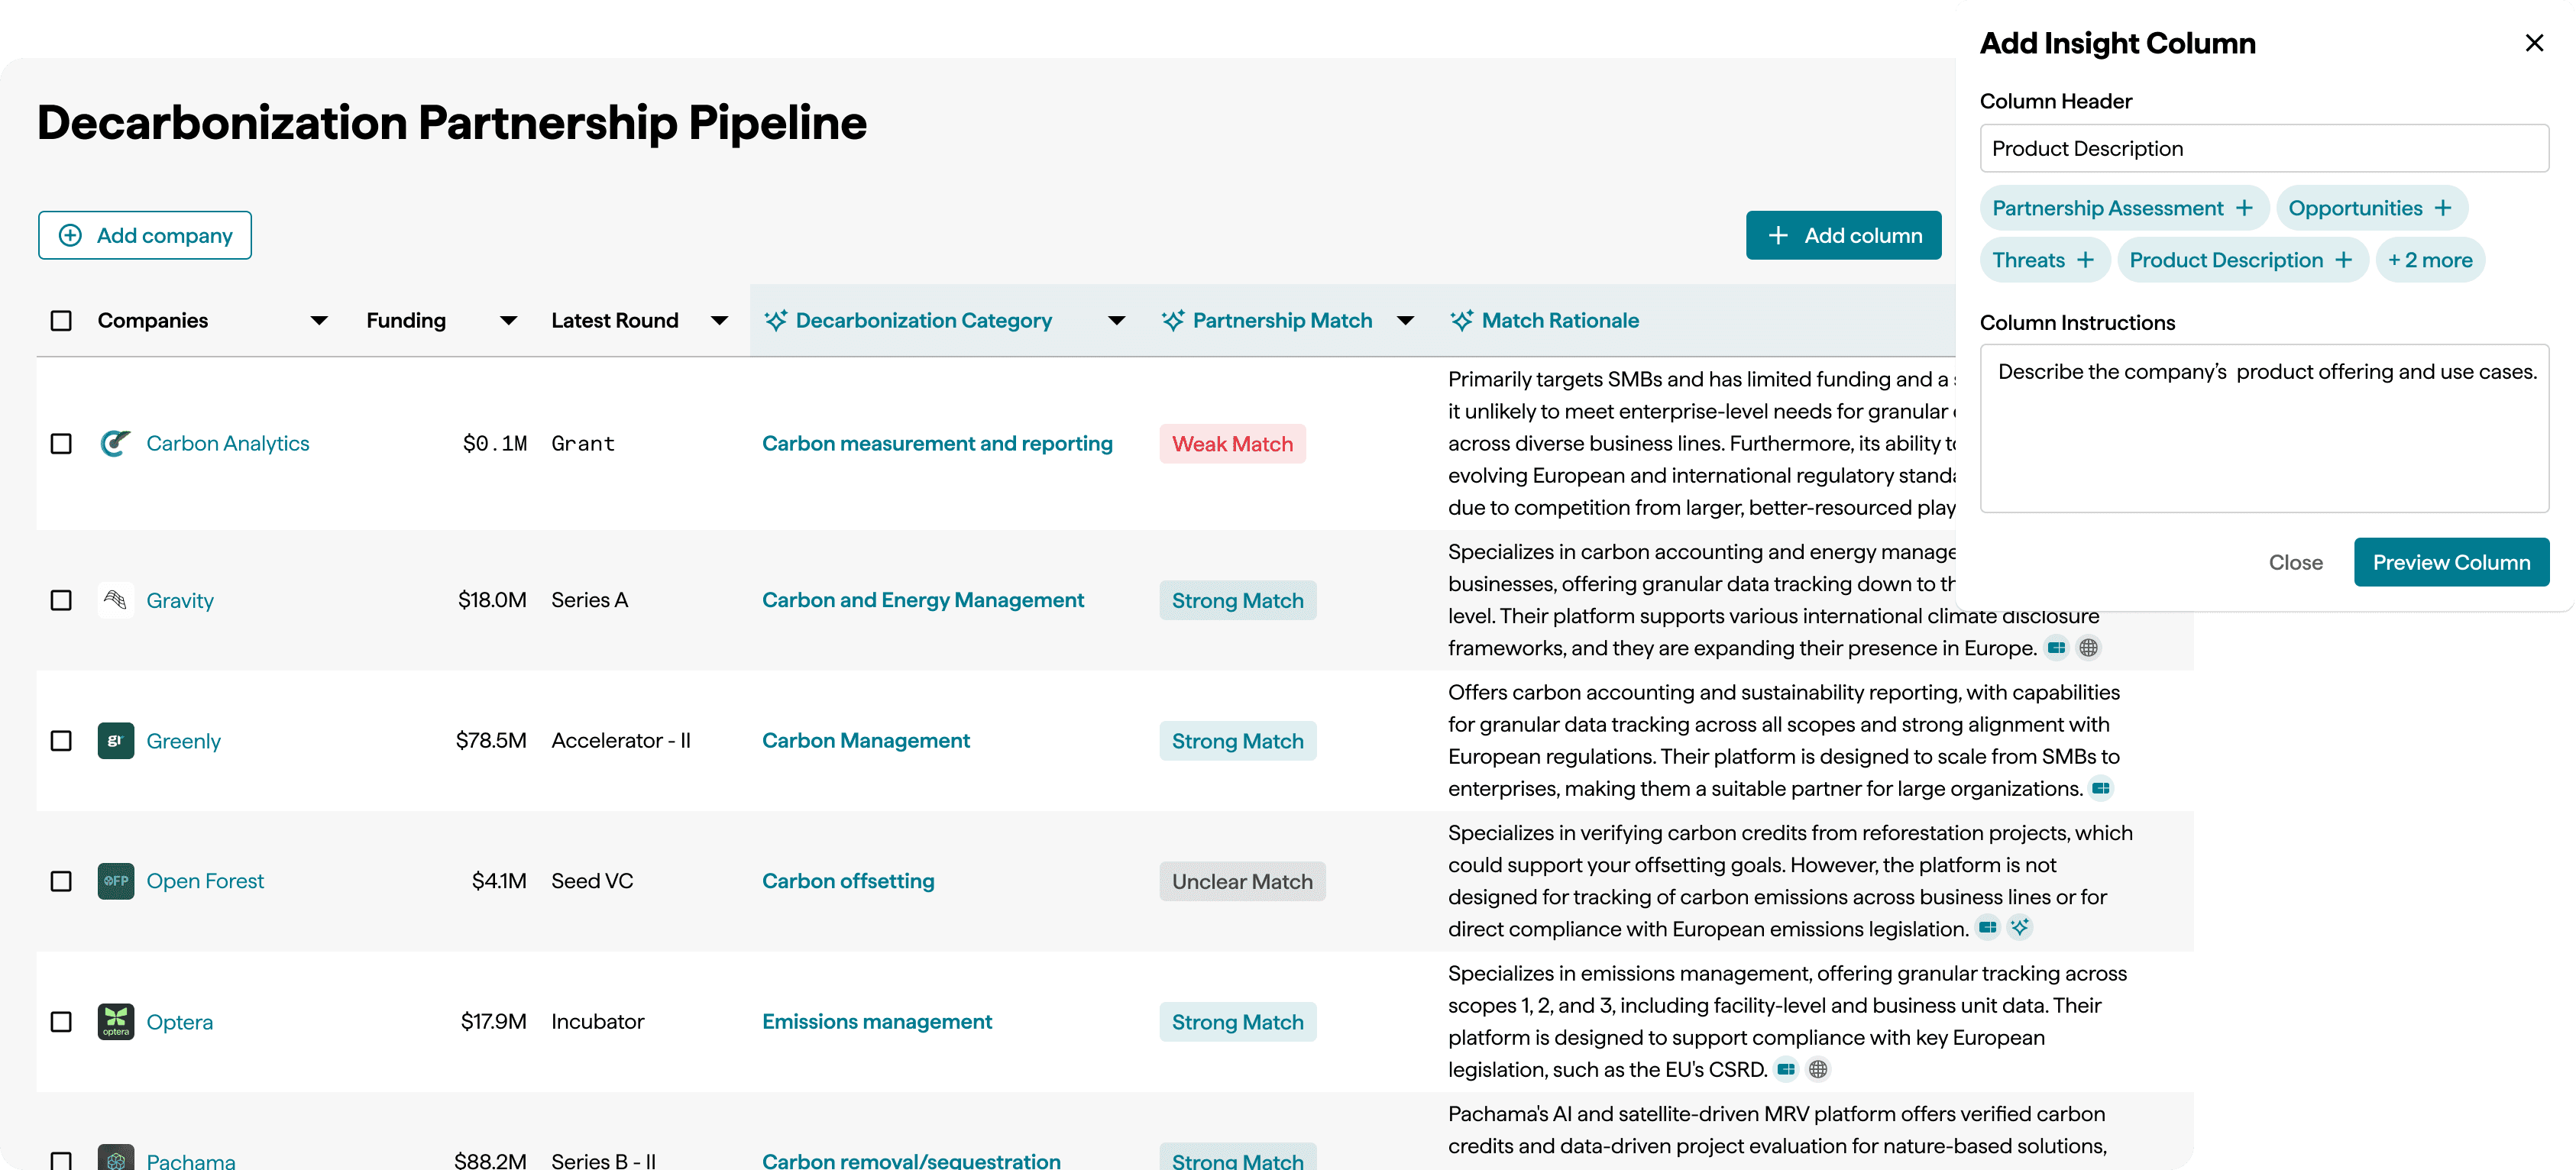
ChatCBI in action for comparative analysis
I had a different point-of-view. The need for scaled comparative analysis was a platform-wide gap. If we built an advanced table inside ChatCBI, we'd be solving one use case in one corner of the product. If we built the underlying infrastructure as a centralized capability, chat would be able to utilize it at a later point.
I pushed back on the proposed solution and advocated for building a standalone feature based around comparative analysis, mixing data and AI. This became the first of several stakeholder conversations that shaped the trajectory of the project.
The User & Problem
Our primary users were Corporate Strategy departments at large enterprises. These teams evaluate markets and decide whether to build a technology in-house, partner with, or acquire companies. That decision relies on their ability to compare dozens of companies across financial, qualitative, and predictive dimensions.

This project targeted the evaluation step of that process: understanding the different players in a market and determining which ones fit the strategy.
We had already made progress in that workflow. Our Instant Insights AI reporting suite could generate full qualitative reports on companies (product offerings, SWOT analysis, and other areas where with structured data gaps). Users found this valuable. But the moment they needed to compare that analysis across companies, they were back to manual work: pulling data from CB Insights, company websites, earnings calls, and news articles, then stitching it all together in spreadsheets and slide decks.
We had helped our users gather data, but we did not help them scale and synthesize their analysis.
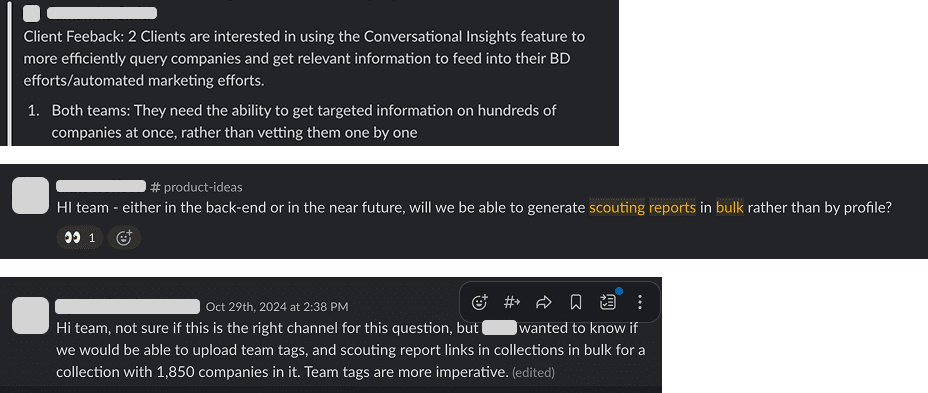
That was an opportunity to save our user a huge amount of time. Since the launch of Instant Insights, users had been reaching out with requests to run bulk reporting or compare company reports side by side. The gap was clear, and so was the value: automate the data collection at scale, provide comparative analysis and take the first step towards synthesis.
Discovery
What the market showed us
I led a competitive analysis to build evidence for our approach and understand the landscape. Three products stood out:
AlphaSense, a primary competitor, had pioneered a similar solution with fully built-out templates that let users get started quickly. Their document infrastructure gave them a strong advantage for public company data, but their solution had two issues:
1. They only provided AI analysis in their tool, no direct data.
2. Their private data coverage just wasn't as good as CB Insights.
Hebbia, an indirect competitor, was a chat-first product that had built a dedicated table interface for scaled analysis. This highlighted one of my original concerns: even companies that had bet heavily on chat needed to invest in a dedicated UI for scaled comparative analysis. However, they also kept chat accessible to edit the table and asking questions about the data.
Attio offered similar column-based AI analysis for their CRM. Their classification feature let users set criteria and used the LLM to tag the companies accordingly. That was something that could definitely be useful to apply to our use case as well.
The competitive analysis shaped my approach in three ways:
The competitive analysis shaped my approach in three ways:I saw that our AI reporting infrastructure and web-informed LLM could produce better answers than competitors, especially for areas with little structured data (like product descriptions).
Competing products didn't source their answers, so we could differentiate by giving users citations where they could verify claims.
I saw an opportunity to merge AI-generated analysis with our hard data in a single space, something none of the competitors were doing.
What users told us
I had discovery conversations with five users in corporate strategy, ranging from Fortune 500 companies to banks to more specialized firms. The goal was to understand how they did this work today, where CB Insights fit in, and where a new solution could have the most impact.
Four key patterns emerged:
Users were building spreadsheets and decks from a wide range of sources, but could rarely gather information fast enough to keep pace with fast-moving technology markets.
Their projects tended to follow similar templates that got slightly adapted each time.
Within those templates, they were trying to bring together financials, predictive data, customer perspectives, and qualitative sources to form a complete picture of each company, then compare across candidates.
While the analysis started in many places (including CB Insights), the synthesis always happened in Excel/Google Sheets.
We also collected customer Excel templates for each client's workflow, which gave us a better sense of what their outputs looked like. This gave me strong enough conviction to move into design, but not before making some critical strategic decisions.
Strategic Decisions
There were three major decisions that had to be made before we started building. They would fundamentally shape our design approach. Each would be in conflict with leaderships' original request, so we needed to build a convincing case to get alignment.
Decision 1: Separate the solution from chat
The original request had been to scale comparative analysis inside ChatCBI. I argued against this from the start. LLMs struggled to build and retain large company lists, which would have meant building list management on top of the chat. ChatCBI was designed to deliver qualitative answers, not large data tables. In addition, building advanced table infrastructure inside chat would have required the LLM to consistently execute a complex feature set (inserting functionality into answers, creating dedicated prompts per column, ensuring standardization across the table), which should be a streamlined and standardized process. All while adding significant load time.
These weren't unsolvable problems, but solving them within a sprint or two was unrealistic. I framed it this way to leadership: we needed to build the core infrastructure for comparative AI analysis, as a standalone capability, and then let chat leverage it later. Leadership agreed, and this reframing set the foundation for the project.
Decision 2: Where it should live
This was the hardest stakeholder conversation.
We already had a feature for tabular analysis called Watchlists. The problem was that the feature was trying to do too much: company sourcing, list management, tabular analysis, news feeds, and performance charts, all packed into one space. It existed across three different sidebar features (Markets, Competitors, and Company Trackers), none of them directly connected. Only 10–15% of users engaged with Watchlists month over month, which meant all that functionality was effectively buried. Adding our functionality to Watchlists would place the new feature three navigation steps deep into the platform, making it very unlikely to succeed.
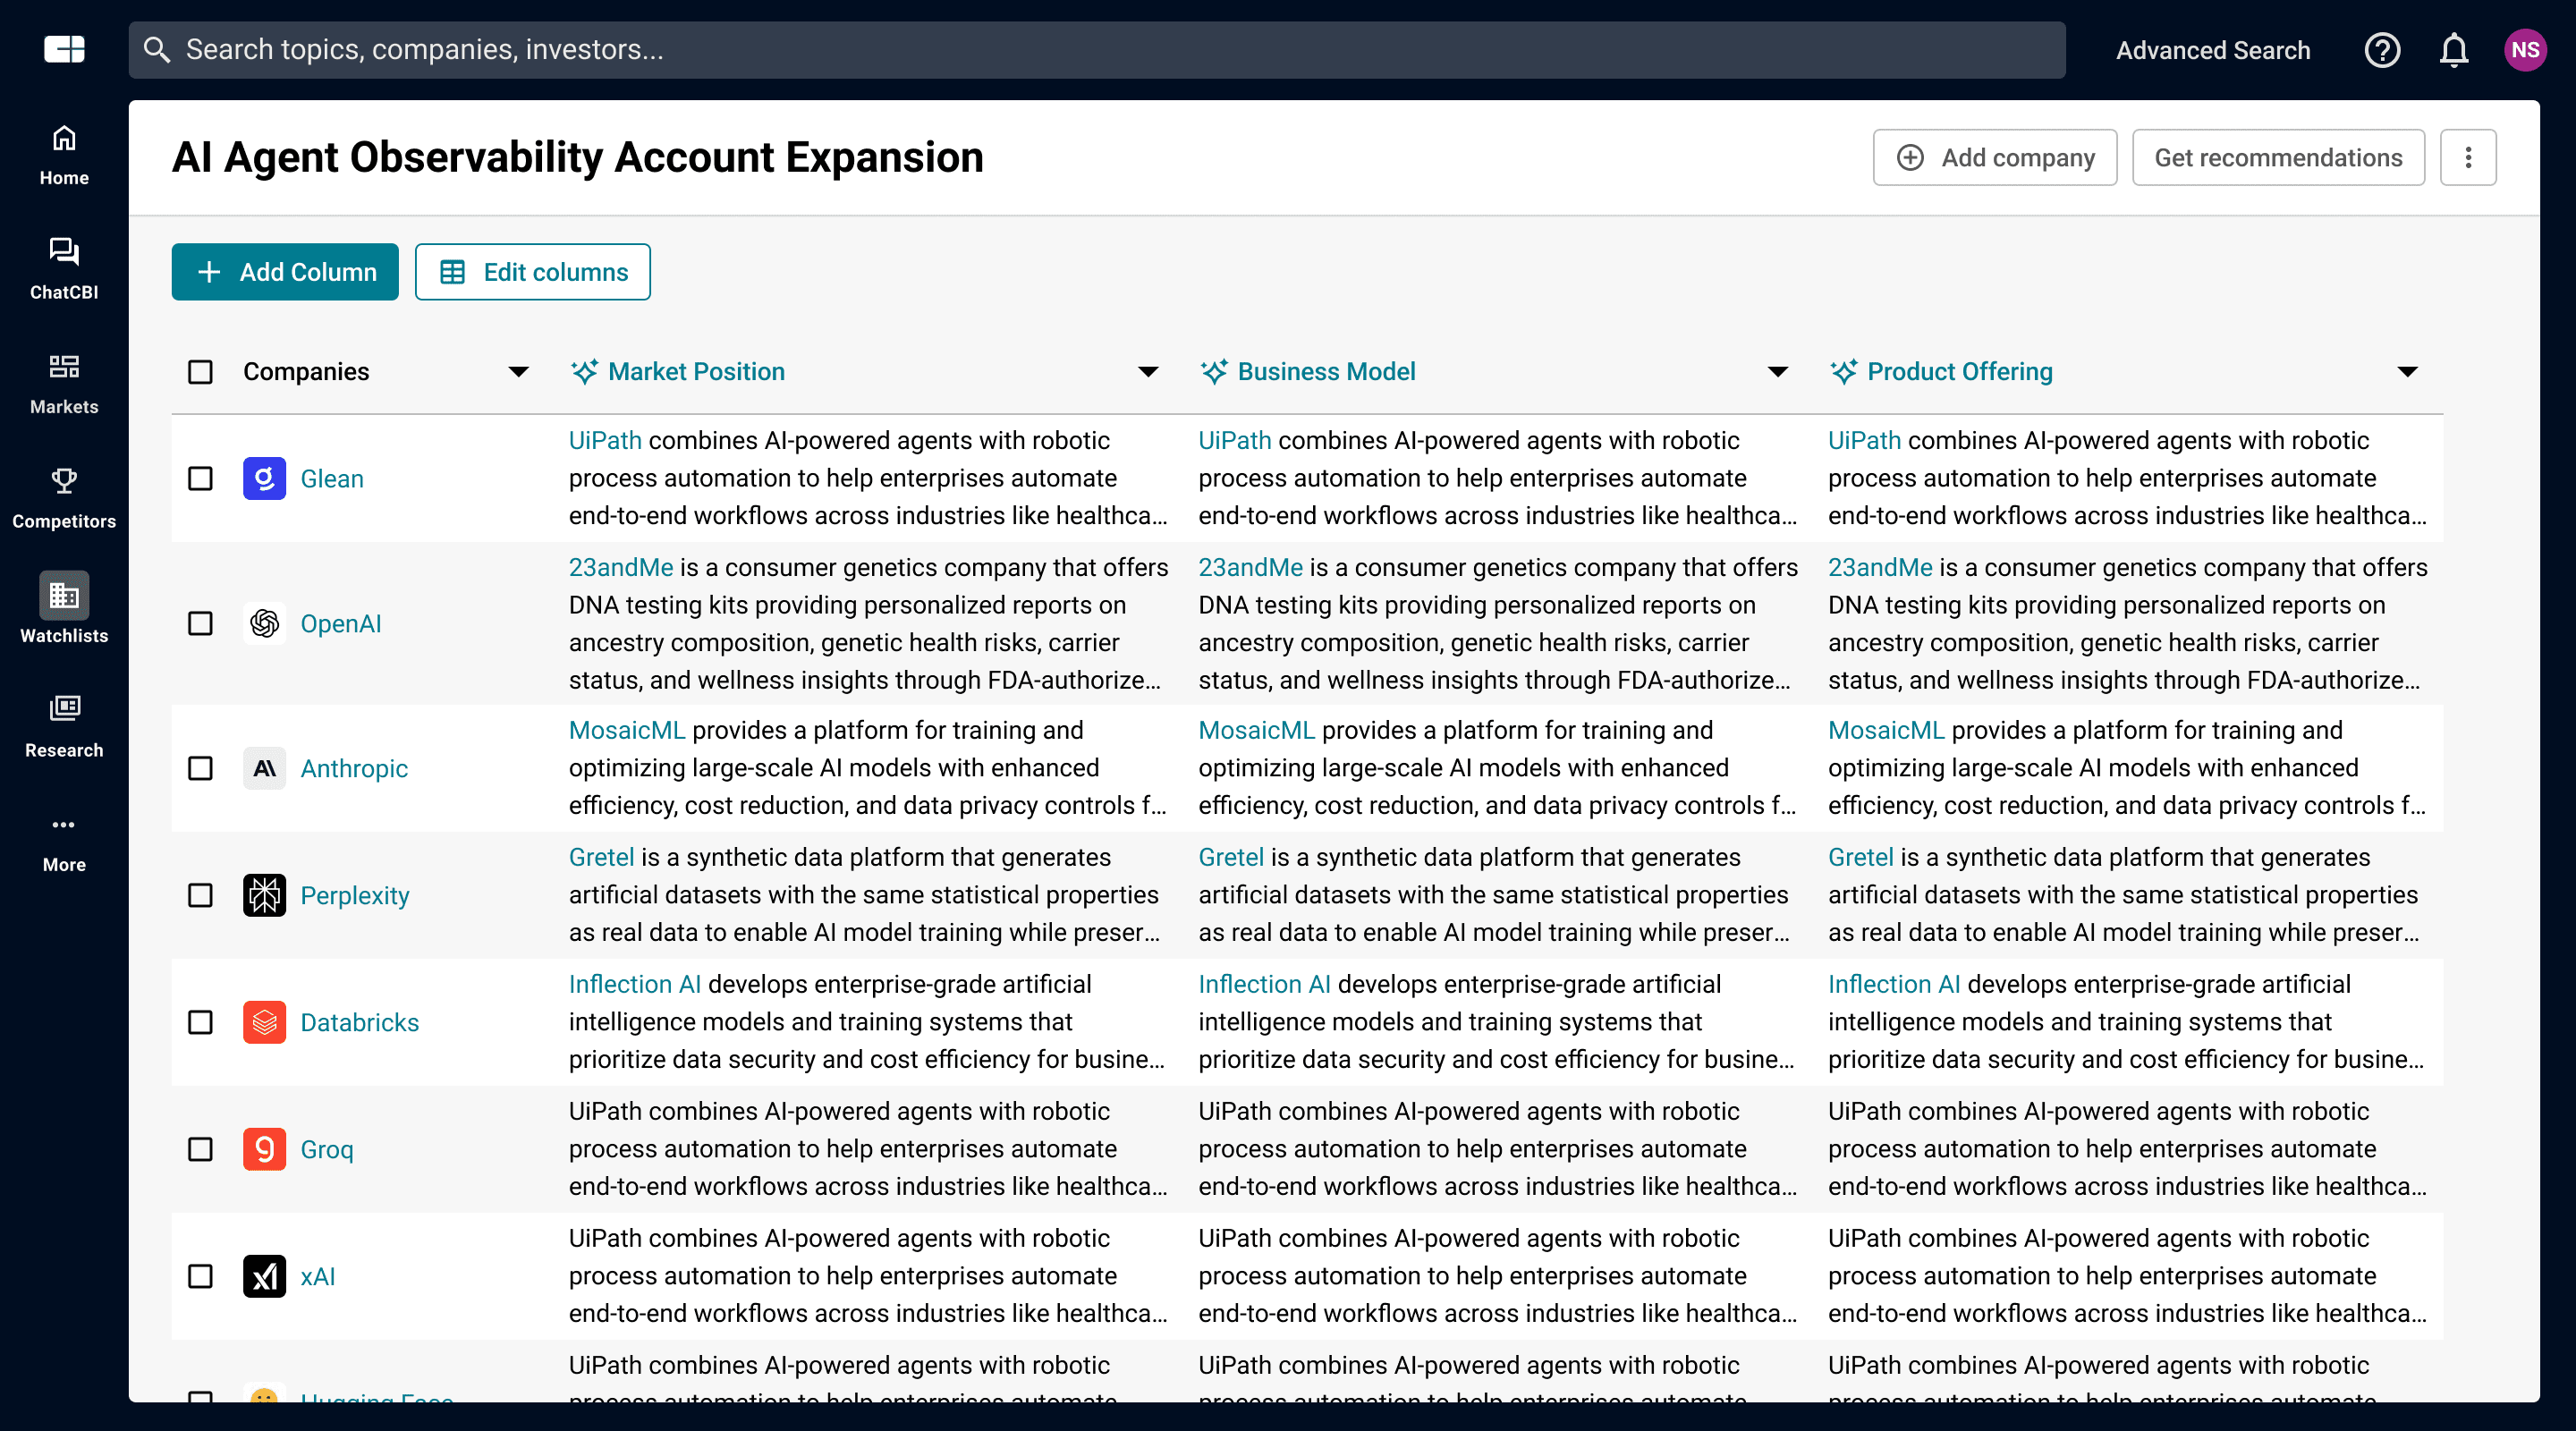
The original infrastructure with our Insights Columns feature highlighted in teal.
I proposed a different model: organize around centralized features. Watchlists would handle list management. The newly developed Dashboard would be the space for aggregated analysis. The Feed would deliver news. And the new Insight Columns feature would be where users conducted in-depth company comparison.
This model was also more adaptable, I saw a future where the same infrastructure could apply to deals, business relationships, and earnings calls, something the Watchlist architecture couldn't support.
The proposed infrastructure.
After several discussions, leadership was not willing to invest in a new standalone surface. The feature would need to live inside Watchlists. I disagreed with the decision, but I understood the constraints: the timeline was tight and introducing a new top-level navigation element had broader implications for the platform. I shifted my focus to making Watchlists work as well as possible for the new feature, which meant the existing UI needed significant work.
Decision 3: Redesigning the Watchlist UI
The Watchlist hadn't been invested in since its launch a year earlier, and it showed. Much of the vertical space that should have been dedicated to analysis was taken by secondary elements. The page was crowded with competing functionality and had no clear hierarchy of user actions. The Top News and Charts tabs were used by less than 10% of Watchlist users (who were themselves only 15% of total active users).
I purposely cut deep. I stripped out everything that wasn't directly related to company analysis. My proposal: move company sourcing to list creation and other platform features, remove the underused tabs entirely, hide secondary actions, reclaim vertical space, resolve the conflicting blue and teal color language, and put analysis front and center.
This kicked off an intensive back-and-forth with stakeholders. Around 40 variations were considered. Product leadership wanted to keep the tabs despite low usage, and two new news-related tabs were being planned. The "Add Company" function needed to come back to the table surface. I held onto the things that mattered most for the new feature, the visual hierarchy of the analysis view, reclaiming vertical space, and making the "Add Column" action the most prominent element on the page, and conceded on the elements that wouldn't undermine the core experience.
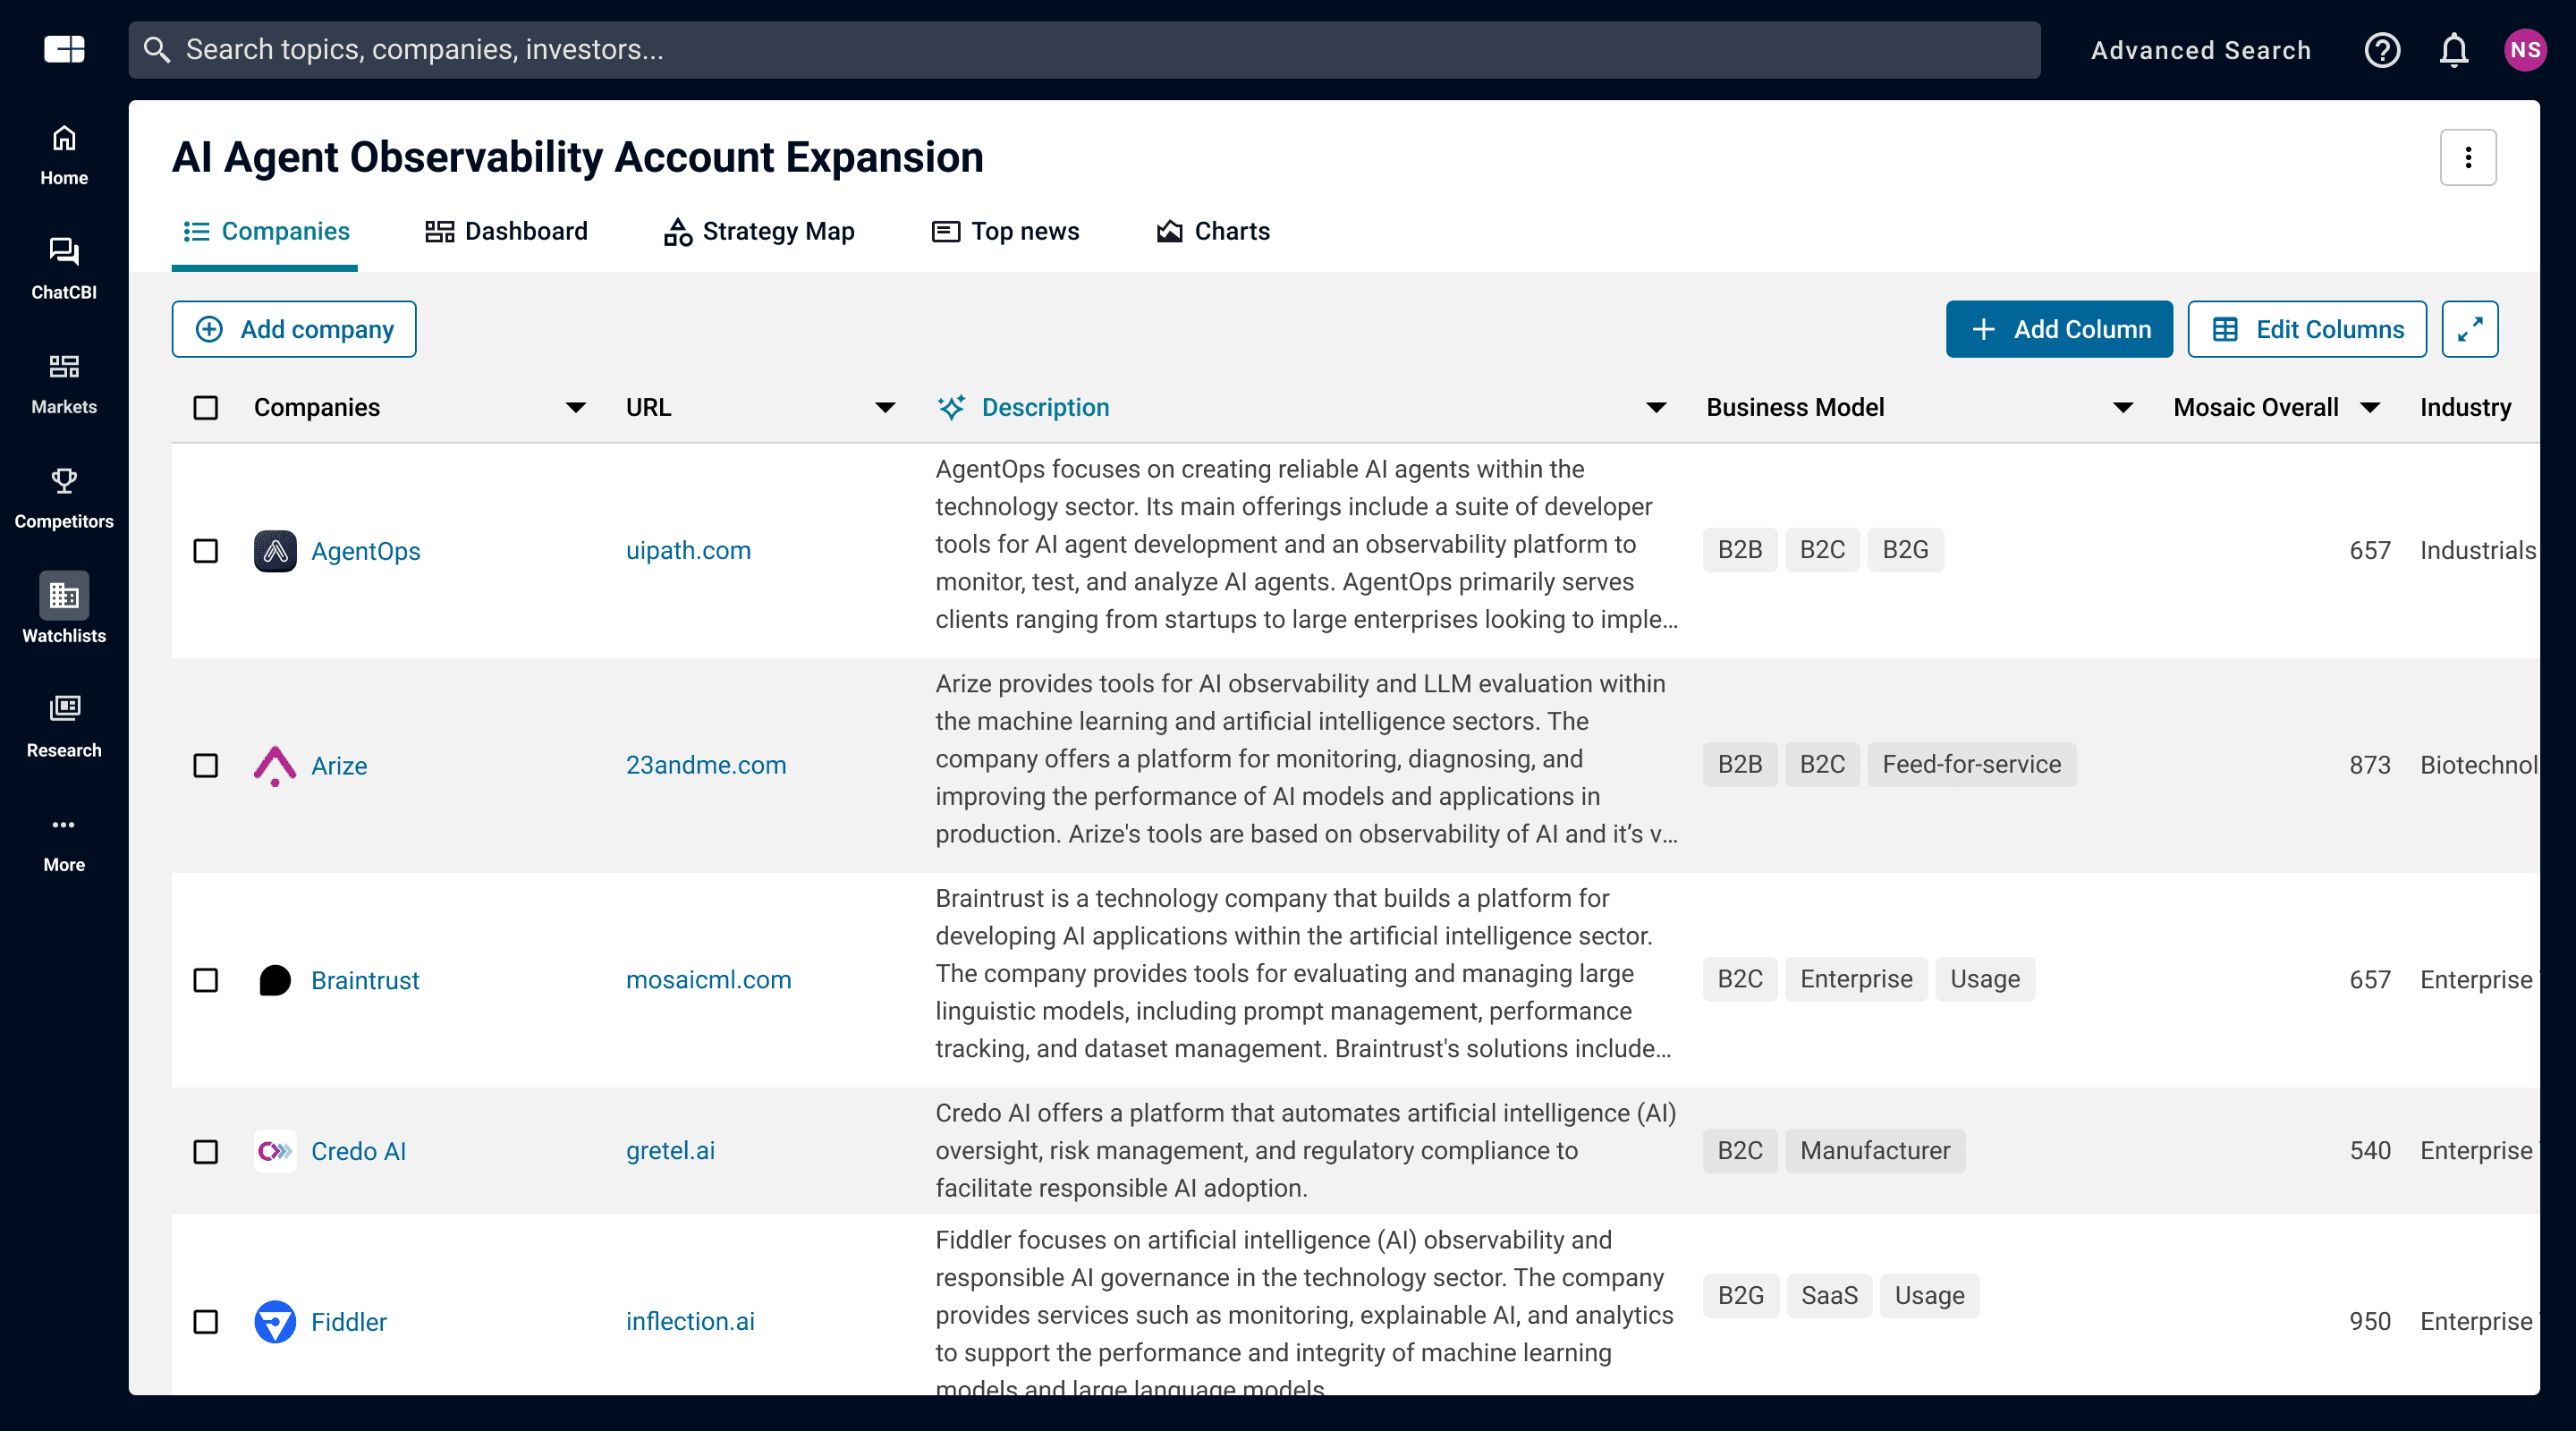
The final design wasn't what I'd proposed originally, but it was much simpler than where we started, and it gave Insight Columns visibility on the page.
Design & Build
With the Watchlist UI simplified, I designed the Insight Column creation flow to be as frictionless as possible. The "Add Column" button was the most prominent action on the page, and clicking it opened a dropdown that clearly distinguished between our standard data columns and the new AI-powered Insight Columns with room for additional column types in the future.

I pushed to keep the creation form minimal. During internal reviews, I received requests for additional fields like formatting instructions and refresh scheduling, but for version one I held on to simplicity: a single prompt field was all the user needed.
In collaboration with a research analyst, we designed six suggested use cases based on our user conversations and knowledge of our data. These served three purposes:
They showed users what the feature could do.
They provided examples of effective prompts.
Most importantly, they let users create high-value columns without any effort.
This was a deliberate bet. I had seen mixed results with suggestions in ChatCBI (about 15% of conversations started from a suggestion), but I believed that in this context, where users were doing structured work rather than open-ended exploration, suggestions would carry more weight. The results spoke for themselves. More on that below.

Once a user committed to a prompt, I added a one-cell preview step. This let the user verify that the AI output matched their expectations before running it across dozens or hundreds of companies. It also served as a cost control mechanism, avoiding unnecessary LLM spend on poorly scoped prompts.

Each generated cell included source citations using the same iconography as our chatbot, letting users verify where the information was coming from. In ChatCBI, we had used marked sources inline using numbers (like standard citations). However, with the column format this was no longer viable. The number of sources could go into the hundreds, and the numbers would quickly start losing their value. Instead, I chose to focus sourcing around the iconography we had established for sourcing in the app. This would allow the user to see at a glance what type of content was sourced, before even hovering the contents.

Validation
Alpha strategy
During the design process, real concerns had emerged around LLM cost and platform availability. Some users had Watchlists with 10,000 companies. A single Insight Column on one of those lists could rack up a significant bill and potentially clog our LLM infrastructure, causing downtime across the platform. The team advocated for an alpha release with a smaller group to load-test before a broader rollout.
I also saw the alpha as a research opportunity. LLM products are difficult to usability test without real AI-generated answers and real load times. I used the alpha to answer five specific questions:
Was the Watchlist placement suppressing discoverability?
Did users understand how to create columns?
Was the output helpful?
Were the suggested columns being used?
And what types of questions were users asking?
What we learned
We activated 70 users for a four-week alpha period through December. They were told they had access to a new AI tool for comparative analysis, but intentionally received little few details on how the functionality worked.
Ten users used with the feature. That number was low, partly due to the holiday period, and partly, I suspected, due to the Watchlist placement.
But the signal from those ten users was strong. Their sentiment was overwhelmingly positive. Half used it regularly throughout the period, with one user generating close to 60 columns. Users who found the feature seemed to intuitively understand how to use it, I saw no evidence of anyone struggling with the creation flow. Over 60% of columns created used the default suggestions, validating my bet on guided entry points. And there were no red flags on LLM usage costs at this level of scale.
There was one non-negotiable. Due to time constraints we had not been able to ship an export function with the alpha version. That turned out to be a complete blocker for our users. The feature was more or less useless unless they could continue their analysis in Excel. Needless to say, we prioritized export for the general release.
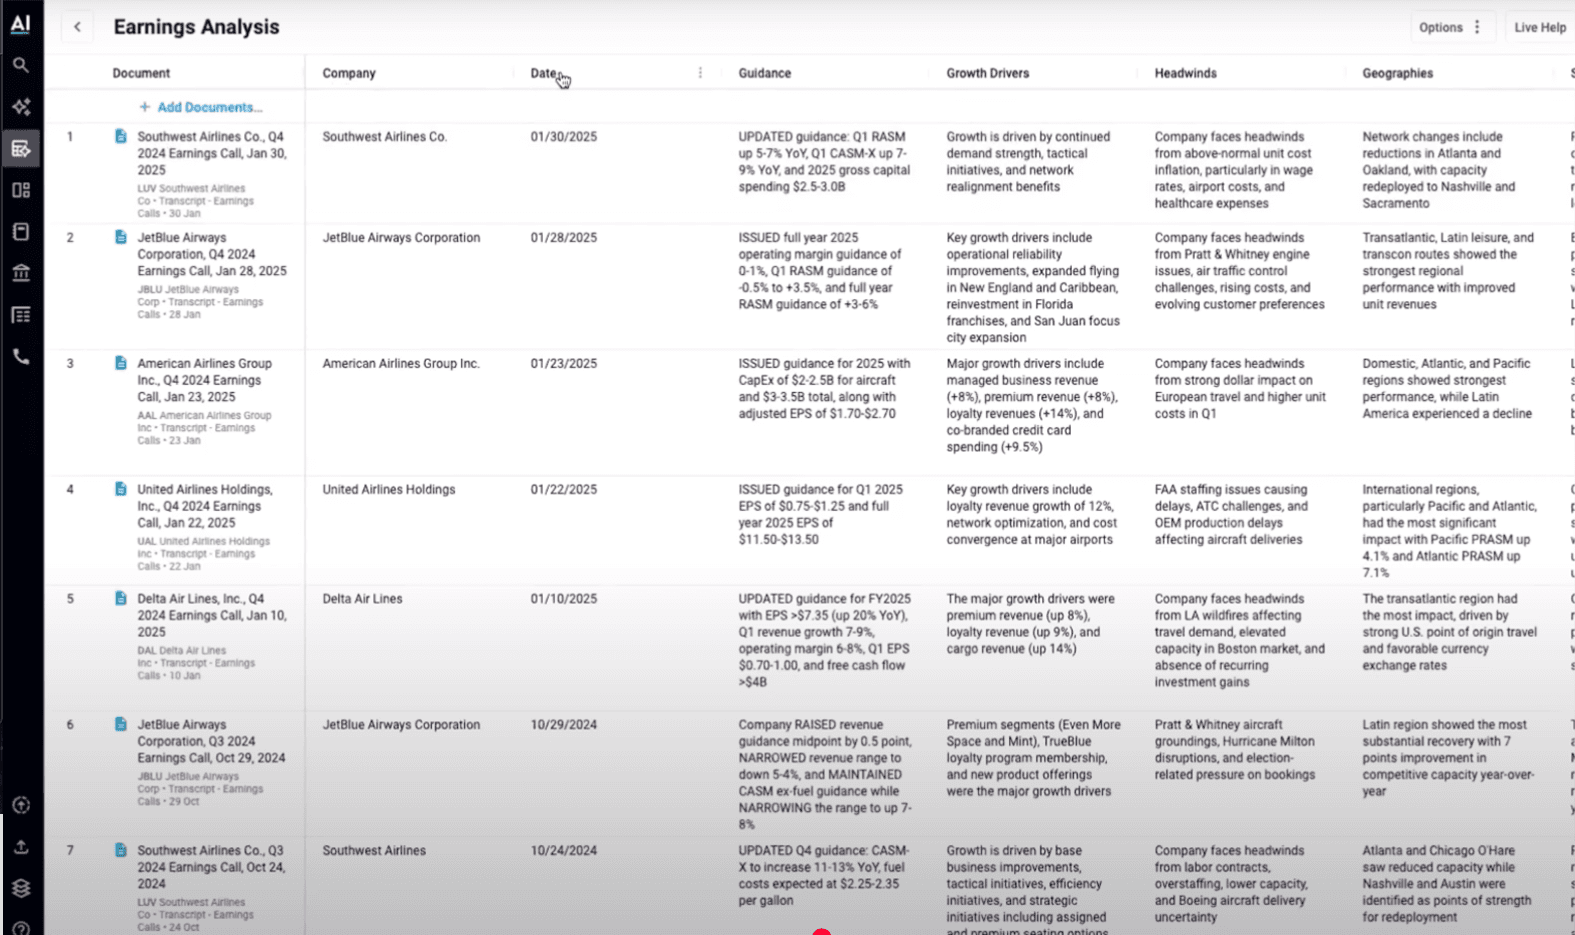
In order to assess quality of our output, the research analyst combed through all the custom prompts users had submitted and the answers they received. The use cases that emerged went beyond what I had anticipated: product differentiation analysis, SWOT comparisons, risk assessments, earnings call synthesis, M&A fit evaluations, hiring, management team analysis. This gave us a much richer picture of how the feature would be used at scale, which we could leverage when building out future suggestions.
Impact & What's Next
Release results
Results are still early, but the initial signals are encouraging. We saw an uptick in Watchlist engagement after launch. Roughly 40% of active Watchlist users generated at least one Insight Column, and the number continues to grow. Two clients have already generated over 2,000 cells each, indicating that power users are extracting significant value.

What I learned
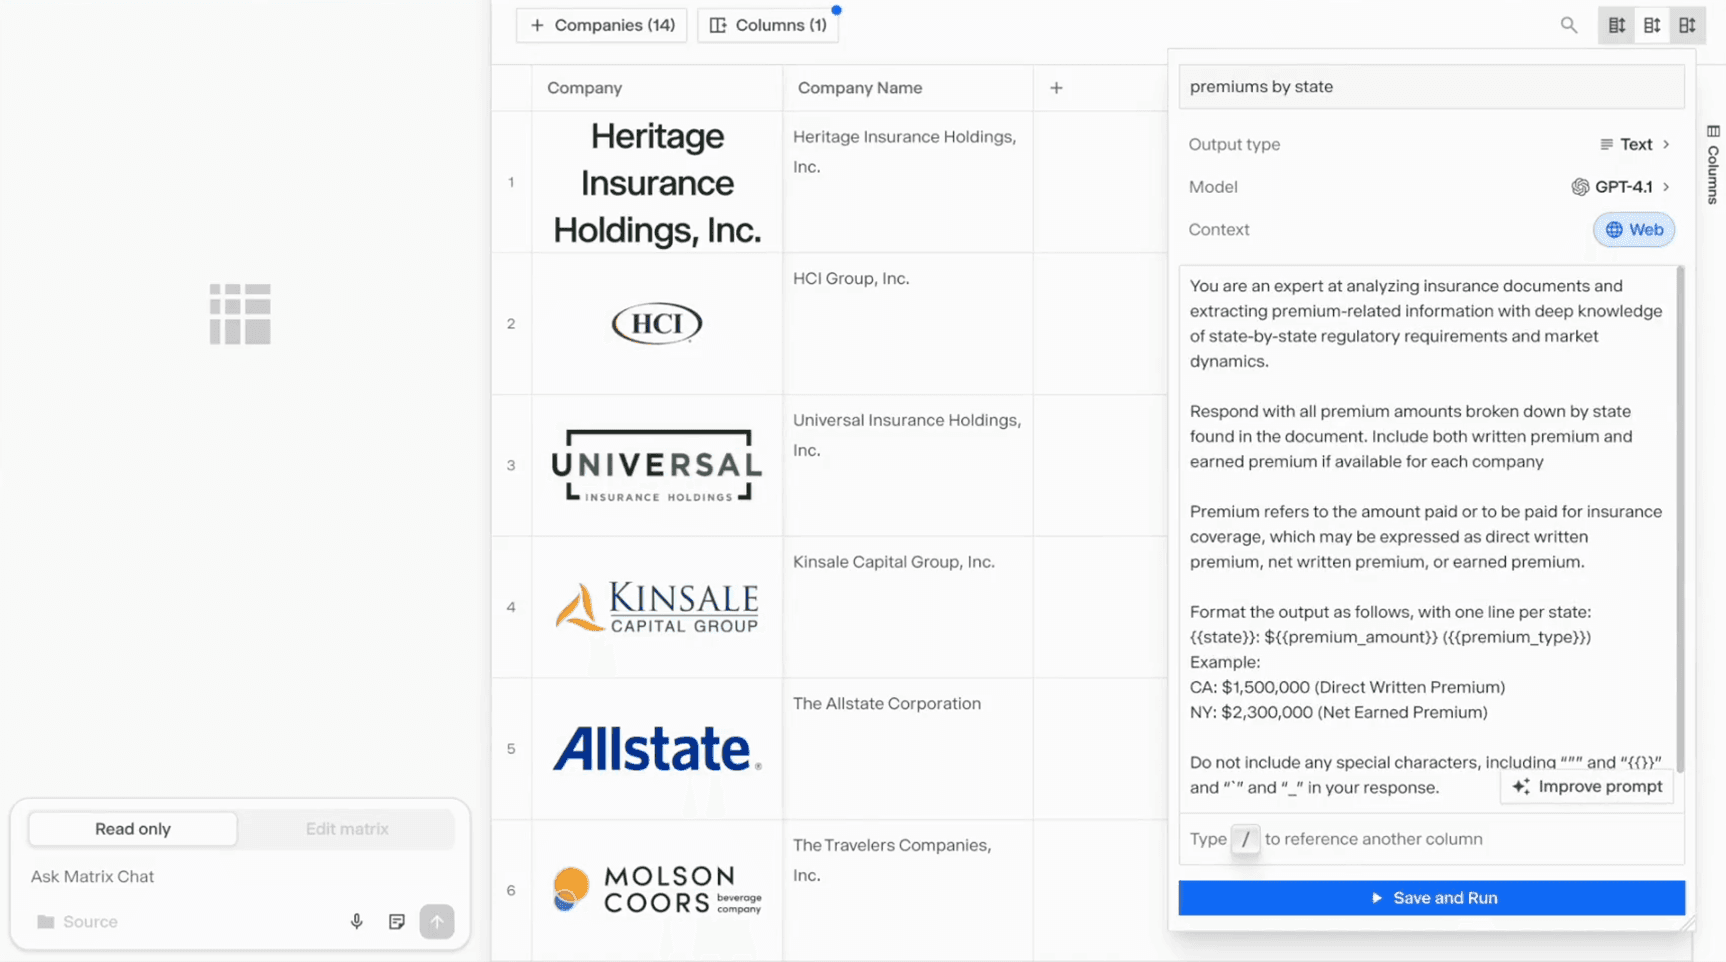
Suggestions are more powerful than I expected. 70% of generated columns came from the suggested use cases, far outperforming the 15% suggestion adoption rate we had seen in ChatCBI. In a structured analysis context, users don't want a blank canvas, they want a strong starting point they can adapt. This reinforced my conviction that templates based on jobs-to-be-done would be the highest-leverage next investment. This was validated in a client lunch-and-learn where I presented a template prototype. The head of a corporate strategy department responded: "doing this research would be the job of three people."
LLM content in data tables needs careful management. Despite extensive prompt tuning, LLMs tended to ignore instructions on brevity and produce lengthy answers. The suggested columns became a workaround, by controlling the prompt, we could better control the output. But this is an area that needs to be developed more as the feature scales.
Having a dedicated research analyst unlocked the team. I had been advocating for this role since ChatCBI launched. Having someone focused on LLM quality assessments, usage pattern analysis, and prompt engineering freed the rest of the team to concentrate on our respective areas of expertise. The analyst's work throughout the process really helped us enhance both our suggestions and answer quality, and in turn directly informed the roadmap.
The road ahead
With the core infrastructure proven, I designed a templates system as the next phase. Working with our research analyst, I identified three initial templates aligned to our users' most common jobs to be done: partnership assessment, acquisition target analysis, and funding assessment. These would give users most of the analysis pre-built, dramatically reducing the effort to get started.


Beyond templates, I scoped two additional column types that users and internal stakeholders had requested: an editable column for personal notes, and a classification column that would let users define criteria and have the LLM categorize companies accordingly.
The final piece, and the one that closes the loop on the original brief, is integrating Insight Columns back into ChatCBI. With the infrastructure now built as a standalone capability, chat can leverage it to construct custom templates based on user requests, enabling more advanced answers and seamless transitions between conversational and tabular analysis. Allowing the chat chat to take advantage of the infrastructure that we had built to provide an easier path to analysis.